The problem with traditional analytics
Your analytics tool shows you a line going down. It doesn't tell you WHY users leave, WHERE they get confused, or WHICH feature they never found. So you guess, ship a change, and the line doesn't move.
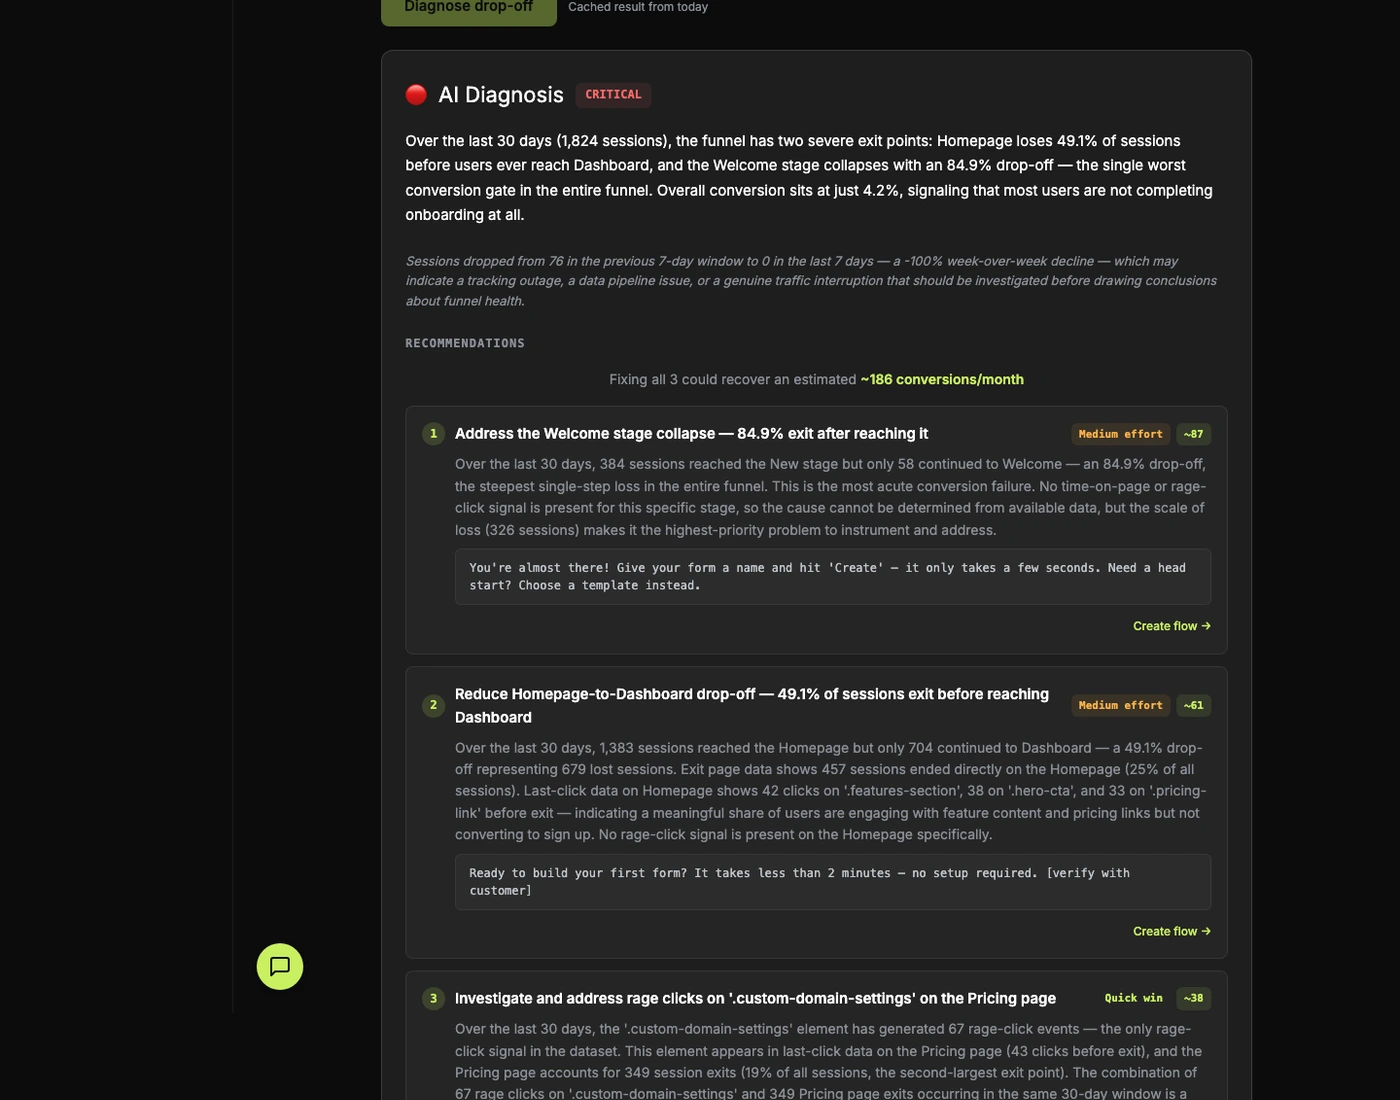
How AI Diagnosis works
Click Diagnose
On any analytics page — funnel, activation, adoption, paths, retention, or events — click the Diagnose button. One click, no configuration.
AI analyzes 7 dimensions
Drop-off rates, exit pages, last clicks, navigation paths, rage clicks, time-on-page patterns, and weekly trends. The AI builds a complete picture of user behavior.
Get fix recommendations
Plain-English explanation of WHY users leave, plus 3 specific fix recommendations ranked by impact and effort. Each includes suggested copy and CSS selectors so your team can ship in code — or, on Deploy and above, click the “Create flow” button to auto-generate an in-app fix. Some fixes need a redesign rather than an overlay (form simplification, removing fields, real product changes) — those are flagged code-only because an overlay can’t ship them.
What you get
- Severity rating (Critical / Moderate / Healthy) so you know how urgent the problem is
- Impact estimates per recommendation — "Fixing this could recover ~X conversions/month"
- Effort badges (Quick win / Medium / Major) for prioritization
- Suggested copy for each fix — ready-to-deploy messaging
- "Create flow →" one-click on overlay-able fixes (Deploy and above) — AI generates a tooltip, modal, or guided tour
- Structural-fix flag — when the fix is a real product change (form simplification, remove a step, change validation), the recommendation is flagged code-only. We never wedge an overlay where it doesn't belong
- Works on every analytics page: Funnel, Activation, Adoption, Paths, Retention, Events, Heatmaps
Competitors sell you an overlay for every problem. We tell you when an overlay is the wrong answer. Some fixes need a real product change — fewer form fields, a different layout, a removed step. The AI flags those as code-only. We’d rather hand engineering an honest spec than sell you a tooltip that papers over the actual problem.
Pricing
AI Diagnosis is available on Diagnose ($149/mo) and above — unlimited at every paid tier. Free is teaser-only.