— The problem
You spend more time defining funnels, writing Jira tickets for the data team, and waiting for custom event tracking than acting on insights. By the time the dashboard is ready, the feature you launched last month is old news. You need answers now — not a 2-week turnaround on a metrics request.
— What you get
- AI proposes the funnels and segments worth tracking — click "Suggest funnels with AI" and Onboardics inspects your real path + event data, ranks the multiple journeys + audience cohorts operating in your product, and lets you accept the ones worth following. Cuts the manual stage-definition work that usually swallows a sprint. Learn more →
- Daily “What changed” feed — open the dashboard each morning to a digest of yesterday’s activation shifts, drop-off spikes, and anomalies, each with an AI-written one-sentence narrative on Diagnose+. The standup-prep view you didn’t know you needed. Learn more →
- Define metrics in plain English — "Activation means they completed their first project." AI translates to measurement rules automatically. No custom events, no data taxonomy, no analytics engineer. Learn more →
- AI Briefing — one AI-synthesized executive summary across every dimension: grade, verdict, top 3 prioritized actions, healthy signals, cross-cutting snapshots. Learn more →
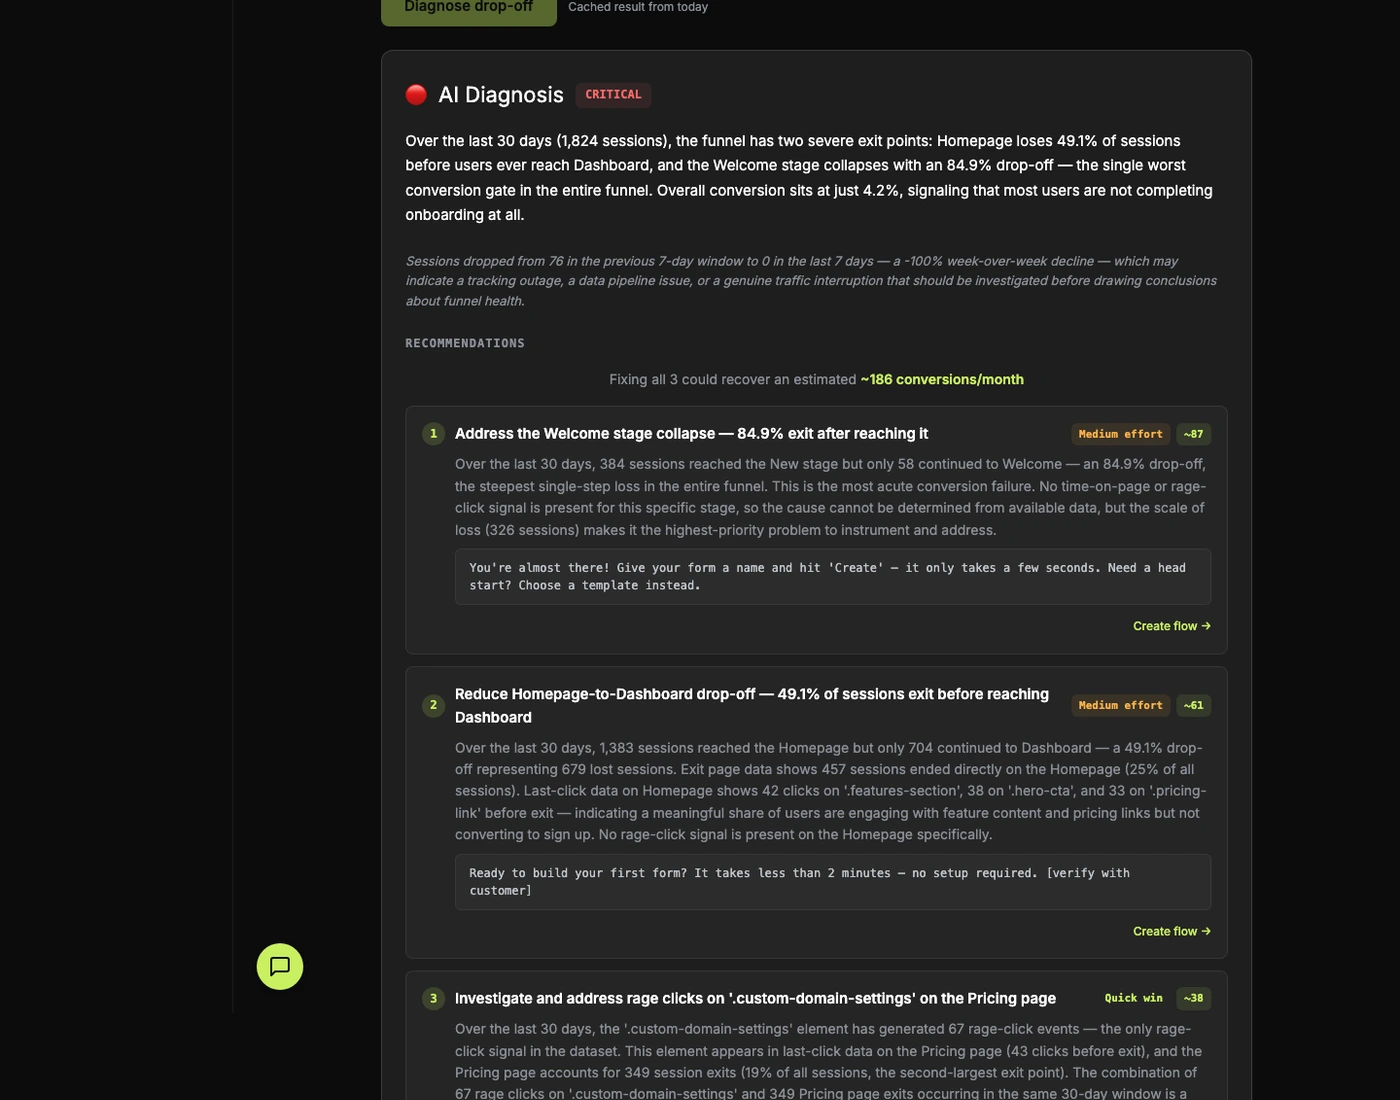
- One-click diagnosis on every page — don't stare at charts guessing why the line went down. Click Diagnose, get a plain-English explanation with three fix recommendations ranked by impact
- Each recommendation tells you exactly what to change — with file, selector, and copy ready to go. On Deploy and above, click “Create flow” and Onboardics deploys it as a no-code overlay in 5 minutes. On Diagnose, hand the code spec to engineering. Or use the diagnosis to redesign in your own way.
- Flow ROI proof card — every shipped flow shows its before/after conversion lift, session count, and statistical significance. The "prove it worked" artifact you can paste into a roadmap review or a quarterly planning doc
- CSV export on every view — download the data for your existing BI tools or stakeholder decks
— Collaboration without chaos
Product managers don't work in a vacuum. Engineers want read-only access to the funnel data. Customer success needs to watch the event stream. Growth wants to edit flows. Everyone wants in, nobody should step on each other.
Onboardics ships with four role tiers — Owner, Admin, Editor, Viewer — enforced server-side on every API request. Deploy includes up to 3 members, Scale 10, Business unlimited. Invite by email, pick a role, done. Learn more about team collaboration →
— From observing to acting
Most analytics tools are observation tools. They show you what happened and leave you to figure out why. Onboardics closes the loop: it shows you what happened, tells you why, and — on Deploy and above — builds the fix as a no-code flow you ship without engineering. The entire cycle, from data to deployed solution, happens inside one tool, in one session.
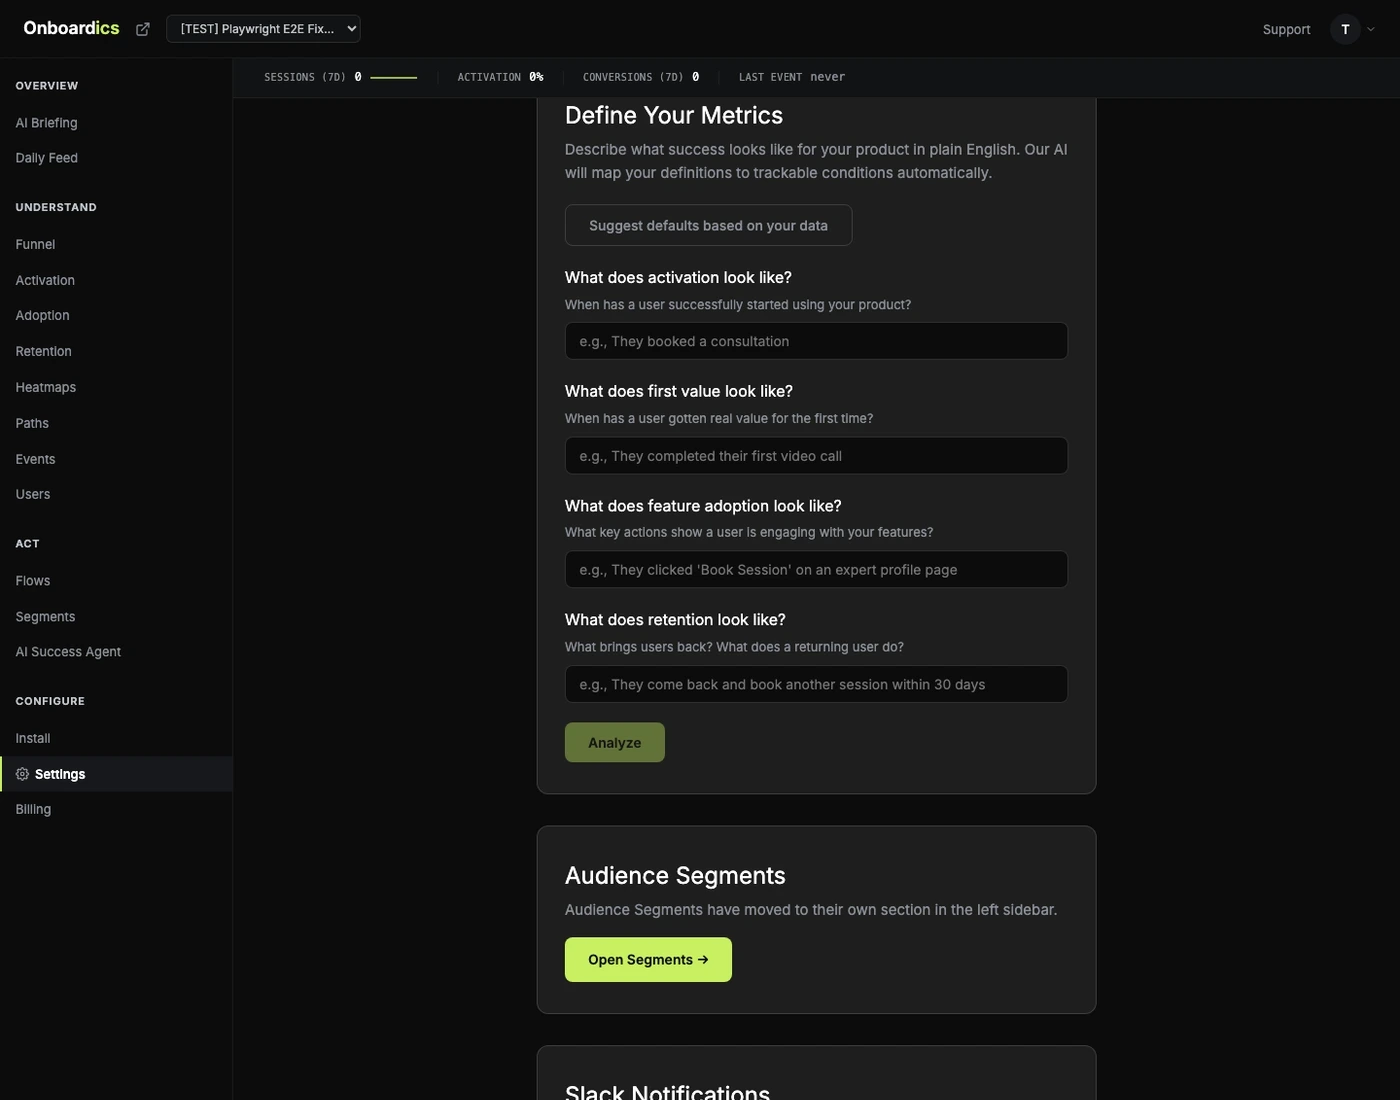
Define metrics in plain English — no SQL, no event schemas.
— How Onboardics fits your stack
Onboardics isn't a replacement for your data warehouse or your BI tool. It's the diagnosis and action layer that sits on top. Keep whatever you use for long-term storage, executive reporting, or cross-team analytics. Use Onboardics for the specific question: "Why are users dropping off and what should I do about it?" It installs in one line and starts answering that question within minutes — no integration with your existing stack required.
The PM toolkit
- Daily feed — yesterday's activation shifts, drop-off spikes, and anomalies in one scroll
- AI Briefing — one-glance executive summary: grade, verdict, top 3 actions
- Plain English metric definitions — describe activation in a sentence
- One-click diagnosis on every analytics page
- Overlay-able fixes deployable as no-code flows without engineering (Deploy and above) — structural fixes are flagged code-only with the spec ready for handoff
- Flow ROI proof cards for roadmap reviews and quarterly planning
- CSV export on every view for stakeholder decks
Deploy · $249/mo
Deploy gives you the full PM toolkit: every AI analytics feature plus the no-code flow builder so AI doesn’t just diagnose the fix — it builds and deploys it. A/B test variants with statistical significance, target flows at AI-defined audience segments, and prove ROI with the Flow ROI card. 5,000 MAU, up to 3 team members, 90-day retention. 14-day free trial with card required.
Need real-time Slack alerts when a flow hits significance? Upgrade to Scale ($449).
Join waitlist