Most analytics tools bury the answer
Every dashboard in a typical product analytics tool shows you data. None of them tell you what to do about it. You end up scanning a dozen charts, copy-pasting numbers into a doc, and trying to synthesize what matters. By the time you've formed an opinion, the data is stale and you're out of time.
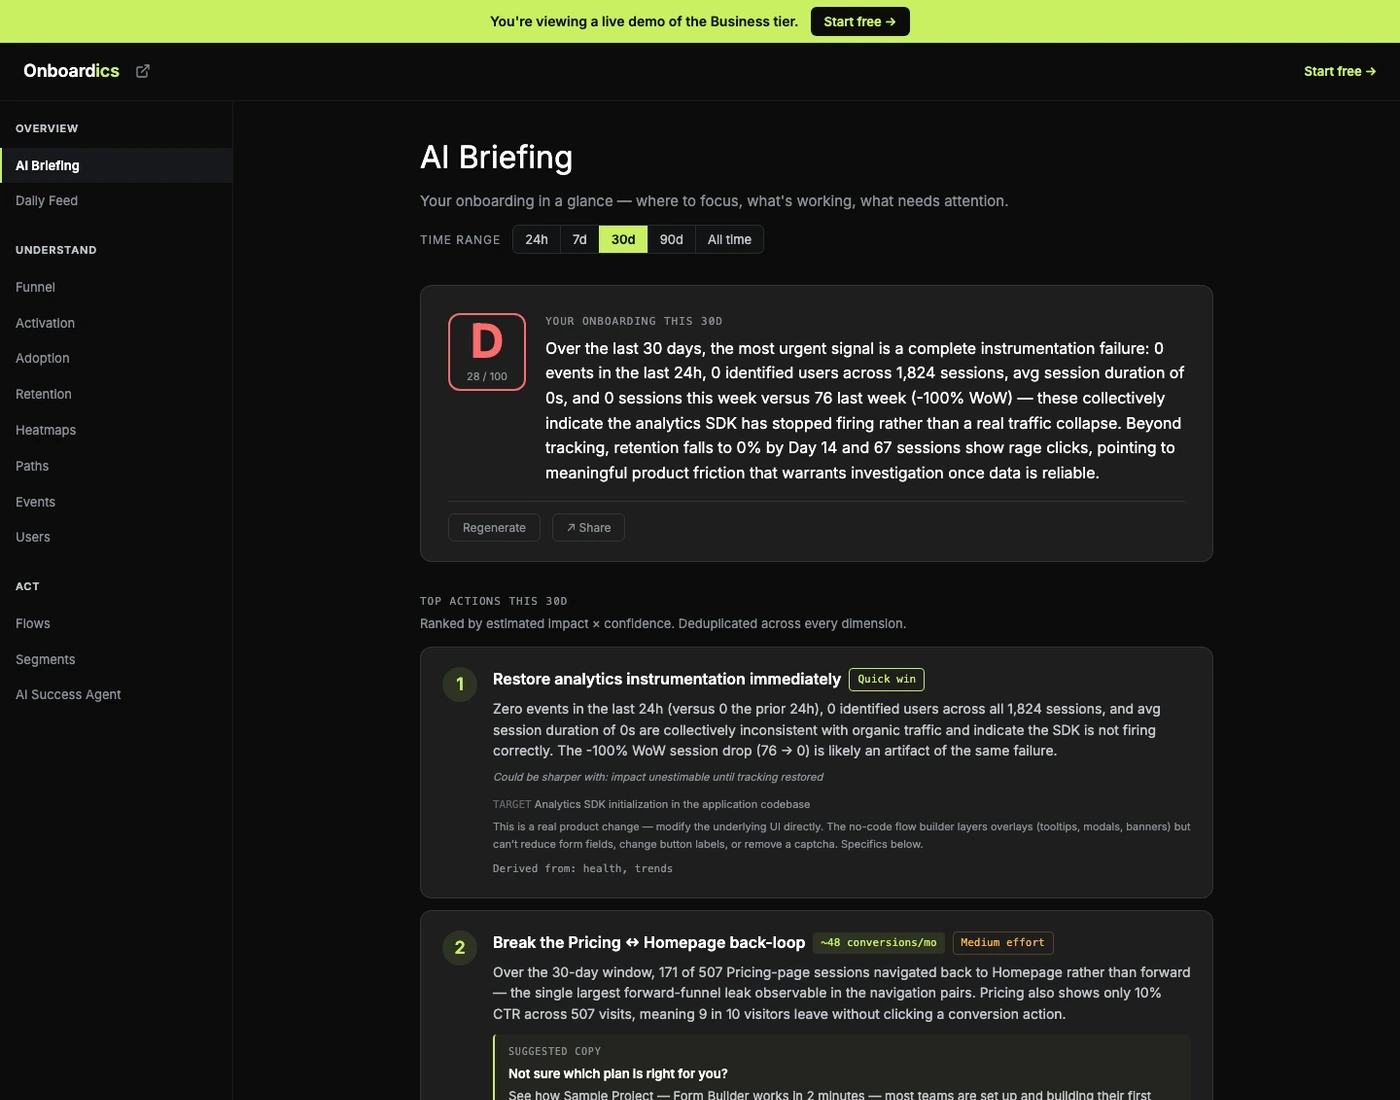
AI Briefing collapses that loop. One page, one AI-synthesized verdict, three prioritized actions. Built for the question you actually show up with: what should I focus on right now?
How AI Briefing works
Open the Briefing
Dedicated “Overview” section at the top of the dashboard. Click it; pre-cached results render instantly. Pick a time window (24h, 7d, 30d, 90d, all time) and the briefing re-scopes to just that range.
Scan the verdict
Letter grade (A–F) + score + 2-sentence summary. Plain English, grounded in specific numbers from your data. Below: your top 3 actions this week, deduplicated across every dimension and ranked by impact × confidence.
Act or drill down
When the fix is overlay-able (Deploy and above), each action has a “Create flow →” button that pre-fills the no-code flow builder with suggested copy. When the fix is structural (form simplification, real product change), it’s flagged code-only with the file + selector + copy ready for engineering. Want deeper analysis? Deep-link chips below route you to the per-page diagnoses (Funnel, Activation, Retention, etc.) where the full detail lives.
What you get
- Letter grade A–F + 0–100 score for your onboarding health over the selected window
- Plain-English verdict: the single biggest takeaway in 2–3 sentences, grounded in specific numbers
- Top 3 actions this week, ranked by estimated impact × confidence, deduplicated across every dimension (if funnel AND retention data both point at the same fix, it's one action, not two)
- Each action: title, why (citing numbers), impact estimate (conversions/month), effort badge, suggested copy, target element (file + selector + new copy), “Create flow →” button when overlay-able, source attribution
- “What's working” section — 2–4 genuine positives worth protecting, so you know what NOT to break
- Cross-cutting snapshots: Engagement Health grade, Weekly Trend direction, biggest Segment gap — each with a one-liner
- Deep-dive chips linking to Funnel, Activation, Adoption, Paths, Retention, Heatmaps, Events for per-page detailed analysis
- One Claude call per briefing (down from ten in the previous version) — roughly 10× cheaper and faster
- Time-range-aware: separate cache per 24h / 7d / 30d / 90d / all window; results are capped at 30 generations per hour per user, cached reads are unmetered
Shareable briefings
Click Share on any briefing and get a public URL that snapshots the grade, verdict, top 3 actions, healthy signals, and cross-cutting one-liners at that moment. Drop it in Slack, paste it in an investor update, link to it in a weekly review — no login required for recipients.
Snapshot semantics: the share is frozen at creation time. Regenerating your briefing after sharing doesn't change what the recipient sees — so you never accidentally share “yesterday's briefing but with today's numbers.” Revoke any share from Settings when you want to pull it back.
Pricing
Every tier can see the briefing. Free unlocks the grade + verdict teaser once per month. Diagnose ($149/mo) gets the full briefing — top 3 actions, healthy signals, cross-cutting snapshots — with 5 generations per day. Deploy ($249/mo) is 10/day. Scale and Business are unlimited. See the full comparison.