Your flow is linear. Users aren't.
You designed a linear onboarding flow, but users don't follow it. Some skip steps, some go backwards, some discover features through unexpected routes. Without path visualization, you're blind to how users actually navigate your product.
How Path Analysis works
Automatic mapping
Onboardics captures every navigation path from your events — no manual flow definition needed. Path normalization collapses UUIDs and dynamic IDs into readable labels so you see patterns, not noise.
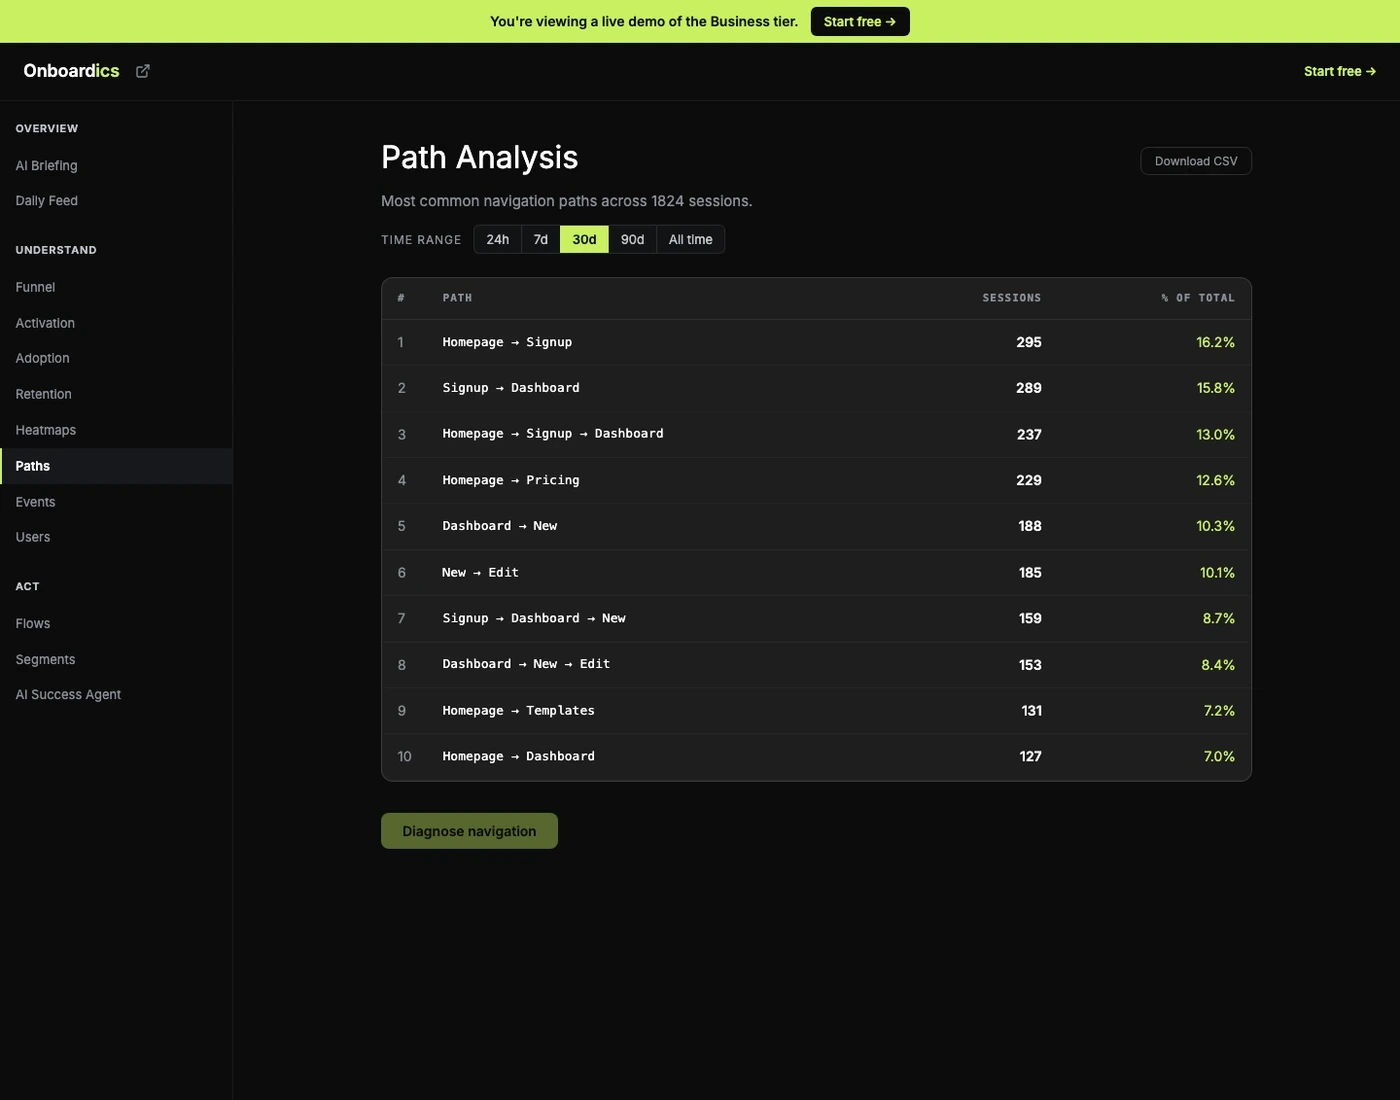
Visualize paths
See the most common user journeys, where paths diverge from your intended flow, and where users backtrack. Paths ranked by frequency so the most-traveled routes surface immediately.
AI diagnosis
Contextual AI identifies problematic navigation patterns — unexpected exits, high-backtrack pages, dead ends — and prescribes the exact fix. When the fix is overlay-able (a tooltip explaining a non-obvious link, a banner pre-empting the wrong-direction click), “Create flow →” deploys it on Deploy and above. When the fix is structural (the dead-end page actually IS broken, the navigation menu is mislabeled), the recommendation is flagged code-only.
What you get
- Automatic path detection from page view events — no configuration required
- Common path visualization ranked by session frequency
- Divergence point identification — where users leave your intended flow
- Backtracking detection — pages users return to before progressing
- Path normalization — UUIDs and IDs collapsed to readable :id labels
- AI-powered path diagnosis with actionable recommendations
- CSV export for reporting and external analysis
Pricing
Path Analysis is available on Diagnose ($149/mo) and above — the entire AI analytics suite ships at the Diagnose tier. Diagnose also includes retention curves, cohort analysis, and feature adoption tracking. A/B testing for flows starts on Deploy ($249/mo); Slack alerts on Scale ($449/mo).